Teachers regularly face competing goals. For instance:
On the one hand — obviously — we want our students to learn.
And, on the other hand, we equally obviously want them to feel safe, comfortable, at home.
To accomplish that second goal, we might decorate our classrooms. The more adorable cat photos, inspirational posters, and familiar art work, the homier the classroom will feel.
But here’s the problem: what if all that decoration (in pursuit of goal #2) interferes with goal #1?
What if decorations inhibit learning?
The Story so Far
I’ve written about this topic a fair amount, and the story so far gives us reason to concentrate on that question.
So: do decorations get in the way of learning? According to this study: yes.
Is this a problem for all age groups? Research done by this team suggests: yes.
When I showed teachers all this research, they often raised a perfectly plausible doubt:
Don’t students get used to the decorations? According to this recent study: nope.
Given these studies (and many others), I think we’ve got a compelling narrative encouraging our profession to rethink decoration. While I don’t think that classrooms should be sterile fields … I do worry we’ve gone substantially too far down the “let’s decorate!” road.
“I’ve Still Got Questions”
Even with this research pool, I think teachers can reasonably ask for more information. Specifically: “what counts as a decoration?”
I mean: is an anchor chart decration?
How about a graphic organizer?
A striking picture added to a handout? (If they’re answering questions about weather, why would it be bad to have a picture of a thunderstorm on the handout?)
An anchor chart might be “decorative.” But, if students use it to get their math work done, doesn’t it count as something other than a “decoration”?
In other words: if I take down an anchor chart, won’t my students learn less?
Because practically everything in the world can be made prettier, we’ve got an almost infinite number of things that might be decorated. (I’ve done some work at a primary school that has arrows embedded in the floor: arrows pointing to, say, Beijing or Cairo or Los Angeles. Does that count as “decoration”?)
For this reason, research to explore this question gets super detailed. But if we find enough detailed examples that more-or-less resemble our own classroom specifics, we can start to credit a “research-informed” answer.
Graphic Disorganizer?
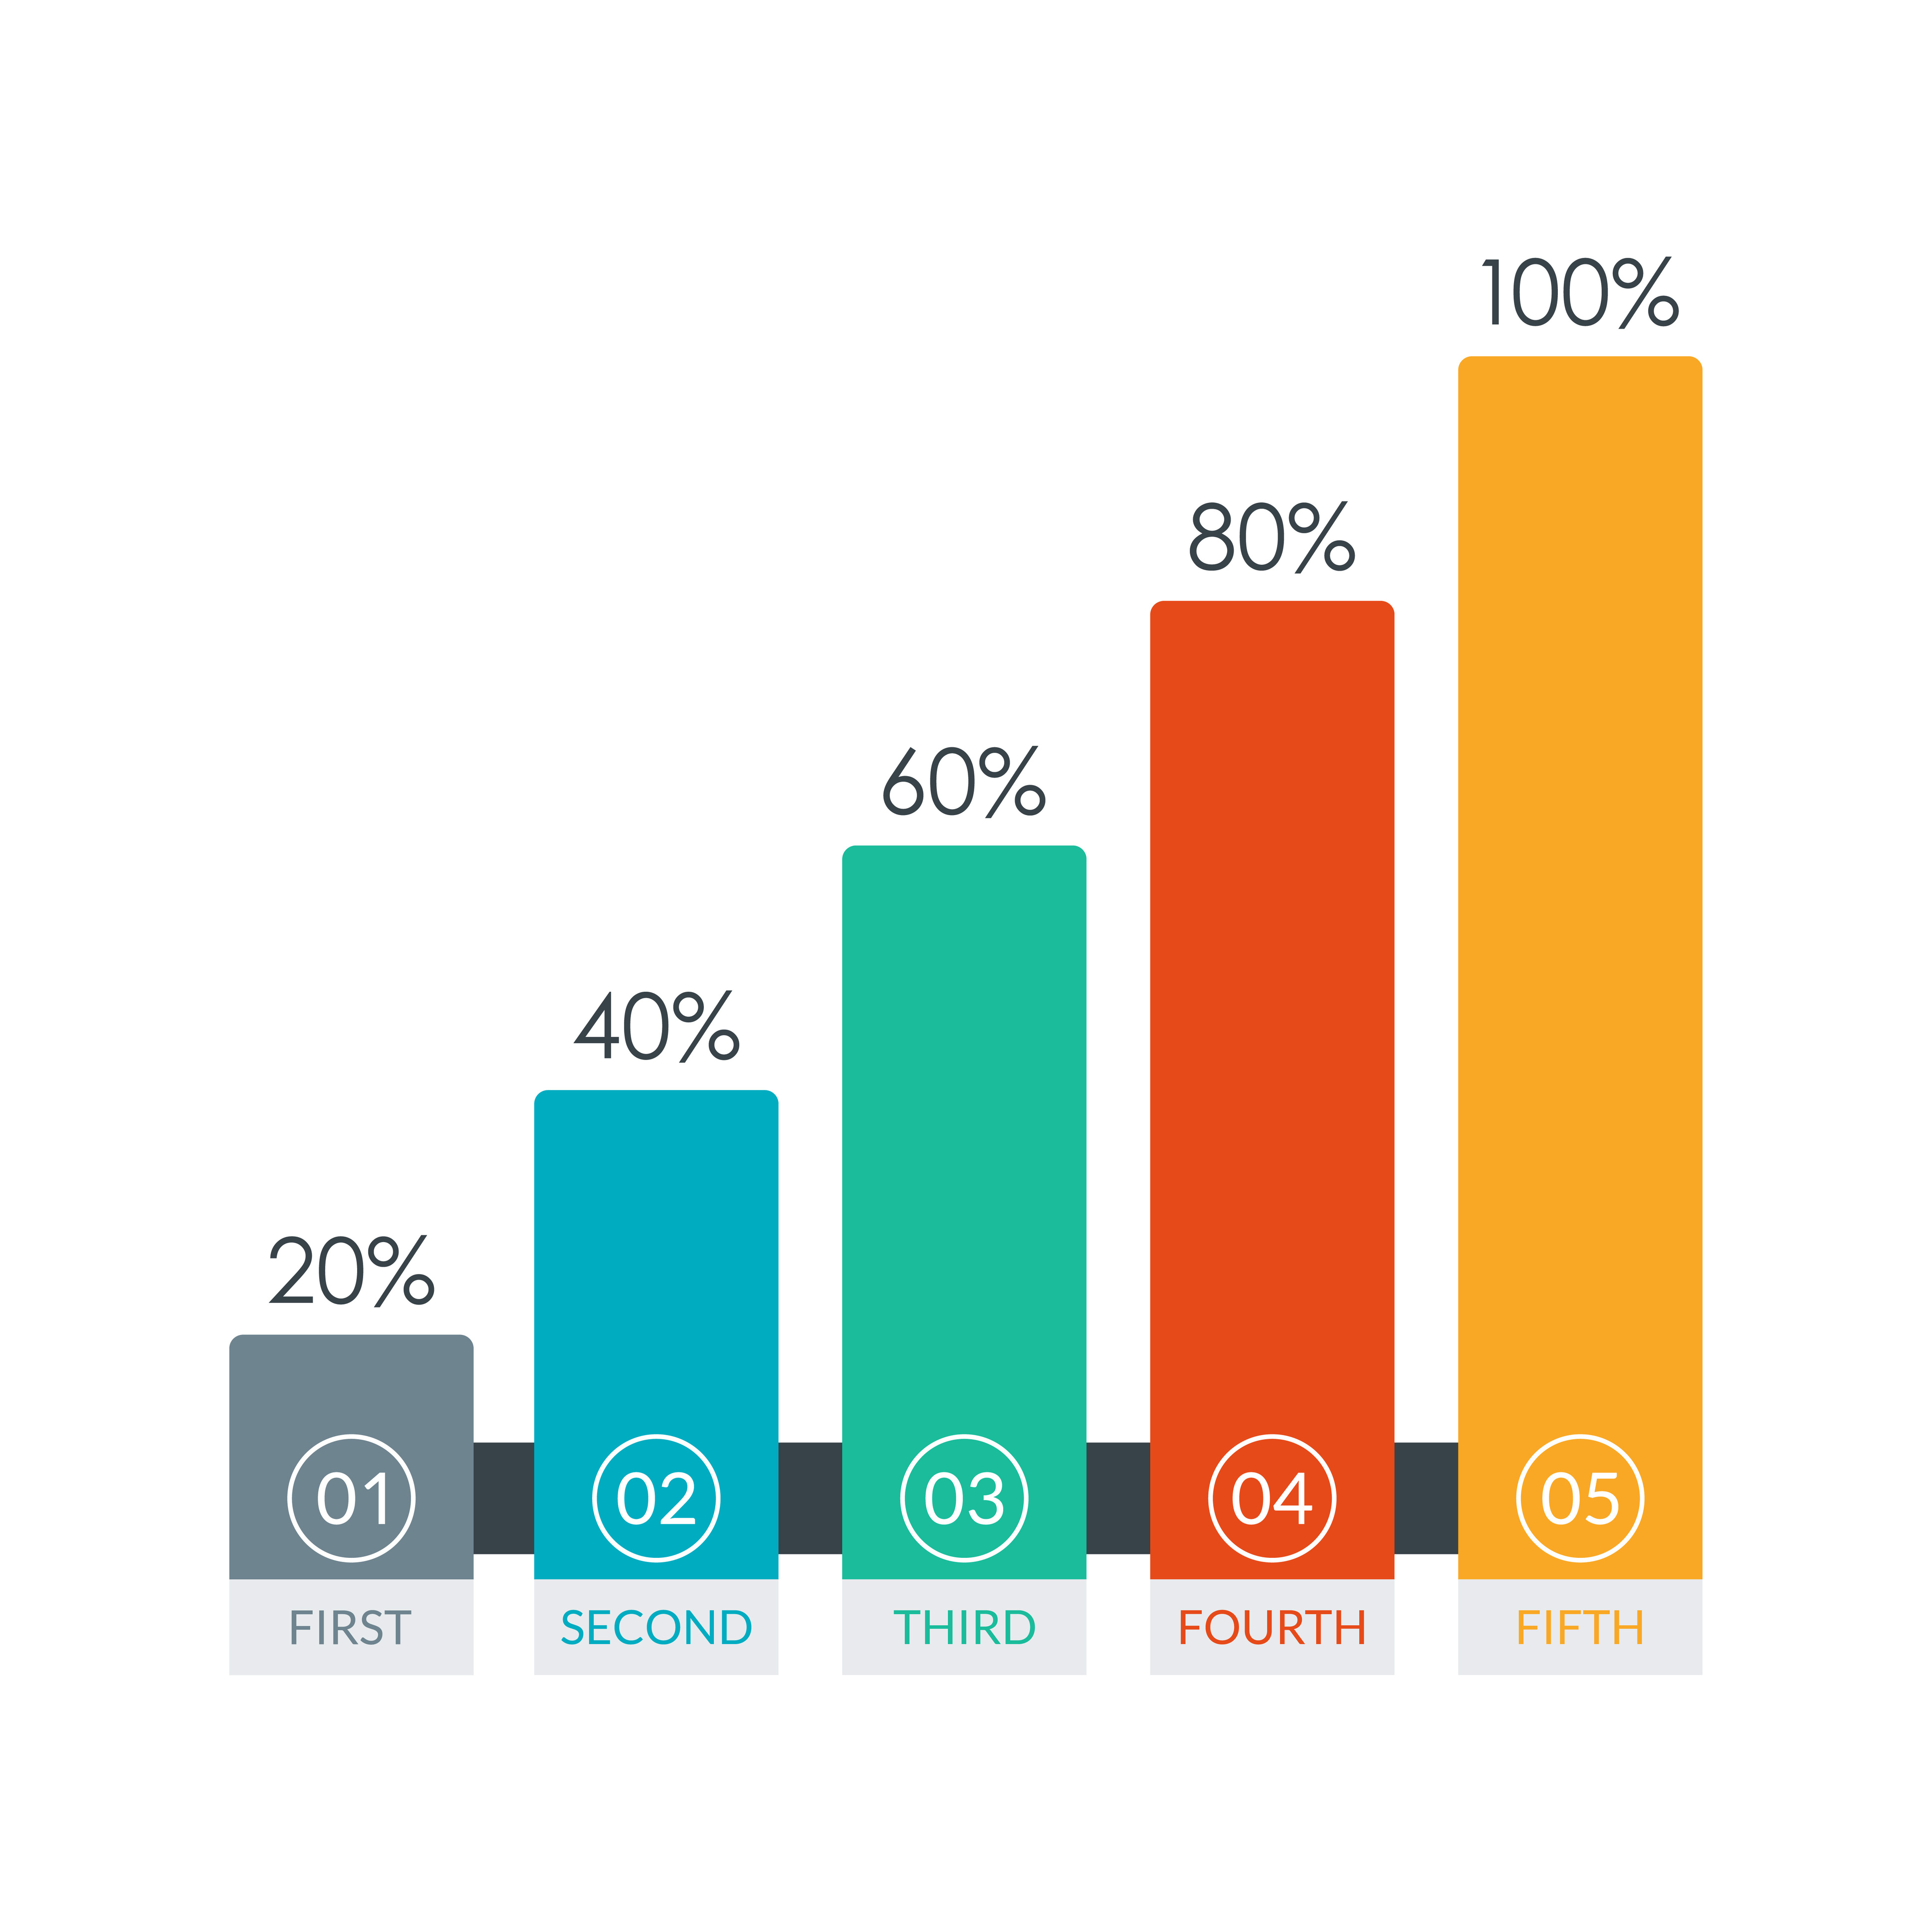
A friend recently pointed me to a study about reading bar graphs.
This research team wanted to know if “decorated” bar graphs make learning harder for students in kindergarten, and in 1st and 2nd grade.
So, if a bar graph shows the number of gloves in the lost and found box each week, should the bar representing that number…
Be decorated with little glove icons?
Or, should it be filled in with stripes?
How about dots?
This study in fact incorporates four separate experiments; the researchers keep repeating their basic paradigm and modifying a variable or two. For this reason, they can measure quite precisely the problems and the factors that cause them.
And — as you remember — they’re working with students in three different grades. So: they’ve got LOTS of data to report…
The Headlines, Please…
Rather than over-decorate this blog post with a granular description, I’ll hit a few telling highlights.
First: iconic decorations inhibit learning.
That is: little gloves on the bar graph made it harder for students to learn to read those graphs correctly.
Honestly, this result doesn’t surprise me. Gloves are concrete and familiar, whereas bar graphs represent more abstract concepts. No wonder the little tykes get confused.
Second: stripes and dots also inhibit learning.
Once again, the students tend to count the objects contained within the bar — even little dots! — instead of the observing the height of the bar
This finding did surprise me a bit more. I wasn’t surprised that young learners focus on concrete objects (gloves, trees), but am intrigued to discover they also want to count abstract objects (lines, dots) within the bar.
Third: age matters.
That is: 1st graders did better than kindergarteners. And, 2nd graders better than first graders.
On the one hand, this result makes good sense. As we get older, we get better at understanding more abstract concepts, and at controlling attention.
On the other hand, this finding points to an unfortunate irony. Our profession tends to emphasize decoration in classrooms for younger students.
In other words: we decorate most where decoration might do the most harm! (As a high-school teacher, I never got any instructions about decoration, and was never evaluated on it.)
In Brief
We teachers certainly might be tempted to make our environments as welcoming — even festive! — as possible.
And yet, we’ve got a larger (and larger) pool of research pointing out the distraction in all that decoration.
This concern goes beyond — say — adorable dolphin photos on the wall, or uplifting quotations on waterfall posters.
In this one study, something as seemingly-harmless as dots in a bar graph can interfere with our students learning.
When it comes to decorating — even worksheets and handouts — we should keep the focus on the learning.
Fisher, A. V., Godwin, K. E., & Seltman, H. (2014). Visual environment, attention allocation, and learning in young children: When too much of a good thing may be bad. Psychological science, 25(7), 1362-1370.
Godwin, K. E., Leroux, A. J., Seltman, H., Scupelli, P., & Fisher, A. V. (2022). Effect of Repeated Exposure to the Visual Environment on Young Children’s Attention. Cognitive Science, 46(2), e13093.
Kaminski, J. A., & Sloutsky, V. M. (2013). Extraneous perceptual information interferes with children’s acquisition of mathematical knowledge. Journal of Educational Psychology, 105(2), 351.


