Exciting news: my book was published at the beginning of April. (I’m resisting the temptation to put in an exclamation point.)
Learning Begins explores the science of working memory and attention, and offers practical strategies for putting this research to work in our classrooms.
Here’s what the first Amazon reviewer wrote:
“This book feels more like a personal discussion with the author. Andrew shares stories with meaning, current useful research, and provides clear suggestions to better teaching methods and student supports. A quick and easy read! Andrew is a proficient educator himself who knows his audience and uses humor and story telling to reach them!”
I hope you’ll read it, and let me know what you think! (Okay, I gave in. There’s the exclamation point.)
(BTW: if you email me–[email protected]–I’ll give you a code for a 20% discount from the publisher.)
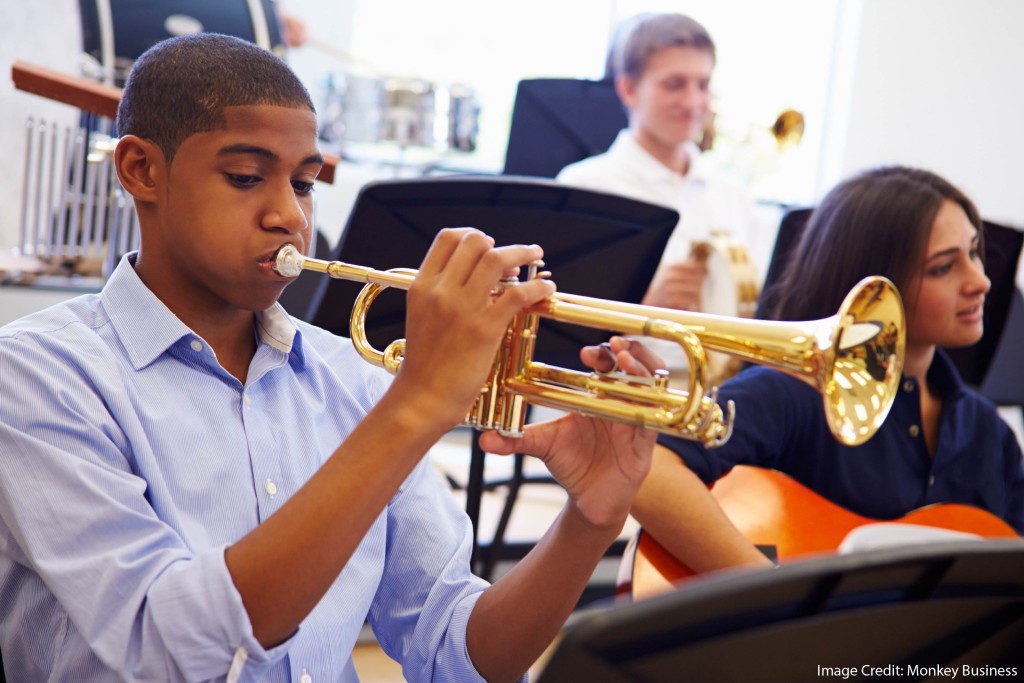
Should 9th graders start music classes–even if they’ve never played an instrument before? Are there academic benefits to studying music? Is 9th grade too late a start to get those benefits? Should my school’s STEM program become a STEAM program?
A recent study by Adam T. Tierney offers some answers to these compelling questions.
The Short Version
Tierney & Co. followed 19 high school students who enrolled in a high school music ensemble, and compared them to 21 students at the same school who started a JROTC program.
These groups started off nicely matched in various academic and linguistic measures. However, at the end of 4 years, the group that had studied music improved in some suggestive ways.
First, the neural signatures of their response to speech changed meaningfully; oversimplifying a bit here, they were “more mature.”
Second, the musicians improved more than the JROTC participants in their ability to distinguish between and manipulate language sounds.
Reasons to be Excited
Tierney’s study gives us several reasons to perk right up.
For example: we’ve known for a long time that life-long musicians have these language processing benefits. Now we have good reason to think that even those who pick up an instrument later in life get them as well.
Another example: this study compares the musicians to the JROTC participants. That is, it does not compare them just to some random collection of non-musicians. Like these new musicians, the JROTC students had a highly disciplined practice schedule, had to function in a structured group, and so forth.
Because the study includes this “active control group,” we can be sure the results don’t come from–say–just being part of an organized school activity.
Most exciting: the students’ improvement in their ability to process language sounds.
This ability–called “phonemic awareness”–gets a lot of research attention, because it can predict success in several essential language skills: reading and writing, to name two.
We test phonemic awareness in many ways. For instance:
“Which one of these words does not rhyme with the others: bell, swell, full, tell.”
“Say the word ‘boat.’ Now, say that again without the ‘b’ sound.”
“How many syllables are there in the word ‘ventricle’?”
If music practice–even music practice begun in high school–can improve students’ phonemic awareness, it just might be able to help them do well in other courses where they have to process language–which is to say: all of them.
Reasons to Remain Calm
Tierney’s study is exciting, but we shouldn’t require all of our students to join band just yet. Here are a few important gaps in this research:
The students enrolled in music class improved their phonemic awareness, but Tierney didn’t measure if that improvement had any impact on, say, their performance in English class; or, perhaps, their ability to learn a new language. That effect is plausible, but not demonstrated here.
Also, Tierney & Co. measured two other linguistic abilities beyond phonemic awareness: phonological memory, and rapid naming. They found no statistically significant difference between the music students and the JROTC students in these two measures.
If one measure out of three shows improvement, that’s good. But it’s not a home run.
And, a point about the research methodology here. These students chose to join band or JROTC; they were not–in the “gold standard” of research–randomly assigned to do so. (Of course: there are many good reasons to let students choose, rather than forcing them into one group or another.)
The differences we see, therefore, might not have to do with the experience of band vs. JROTC. Instead, they might be differences in the kind of 9th grader who wants to be in band vs. the kind of 9th grader who wants to be in JROTC.
In other words: perhaps those band students were always a little better at discriminating among sounds, which is why they were drawn to music in the first place. Tierney’s team did try to rule that out with their various pre-study measures, but perhaps those differences are not captured by the tests we have.
We just don’t know. (Or, better said: we don’t “know” in the way that scientists want to know things.)
A Final Point
I understand why people are attracted to this argument: “students should do art because it makes them better at other things we do in school.”
I am more attracted to this argument: “students should make art because it’s an essential expression of human joy, sorrow, love, solitude, fun, reverence, and hope.”
In other words: I don’t think schools should foster art because it makes people better at STEM. I think schools should champion art because it makes people better at being people.
As an easy-to-read and engaging textbook or as a scientifically accurate and detailed popular psychology book, David Eagleman’s The Brain: The Story of You is an ideal book for people seeking to teach themselves an introduction to cognitive neuroscience and psychology. Eagleman, a neuroscientist, New York Times best-selling author and an adjunct professor at Stanford, frames each chapter of the book with lofty, existential questions such as “Who am I?” and “Who will we be?” In this book, Eagleman reviews how the human brain develops, how our senses and ability to perceive the world develop, how external factors influence our actions and decision-making, why we are such social creatures, and how technology might augment and extend our lives.
The human brain undergoes substantial development throughout our lives, particularly from birth through adolescence. Indeed, it must undergo more development after birth than does the brain of nearly any other species. Our brains are shaped substantially by the context in which they develop. They need all kinds of stimulation and social support to develop optimally. We are very social creatures. For example, we see social relationships even in inanimate objects; babies can demonstrate a preference for characters who are nice as compared to ones who are mean; and we act like the people around us.
As an incredibly calorically expensive organ, we depend on our brains for a lot of what we do. For example, while we colloquially say that we see through our eyes and smell through our noses, really we perceive the world through our brains’ interpretation of the information received through other organs. This interpretation means that we are not necessarily experiencing an objective relative. Rather, we experience what we expect to sense. Eagleman explains how our brain supports us in experiencing each of our senses. Even seemingly simple and mundane tasks such as walking or sipping a beverage requires a significant amount of coordination across our senses, which our brain orchestrates.
Eagleman explores how we make decisions and how we choose to act. He argues that there are numerous unconscious influences on our actions. While our brains lead us to believe that we consciously make choices, evidence from many sources suggests that we often choose unconsciously, and only generate a justification consciously. Physiological signals can also influence our actions and steer our decision-making. Brain systems compete for the ability to guide our actions and decisions. This has been demonstrated with patients who have had the two hemispheres of their brains severed from one another. In these people we see one hemisphere will lead the person to perform an action that contradicts the action the other hemisphere wishes to perform. Deeply troubled by humans’ evil actions against others, Eagleman reviews work about how on micro and macro scales we decide to mistreat others. He argues ceasing to see others as people (i.e., dehumanizing them) and instead seeing them as objects is a primary mechanism by which we choose to mistreat others.
Our brains are driven both to seek rewards and to plan for the future. People often establish a contract between their current self and their future self to help resist present temptations and increase the likelihood of performing adaptive behaviors for the future. For example, as someone tries to quit smoking, she might give a friend a large check made out to an organization she despises and tell the friend to mail the check if she smokes again. Eagleman reviewed work that he has led in which he attempts to use neurofeedback (i.e., providing people with information about the relative activity of a part of the brain that is involved in seeking rewards versus a part involved in thinking about the more distant future) to help people addicted to drugs regulate their cravings, thereby resisting current rewards to live a healthier life.
Eagleman concludes with a fascinating exploration of the way in which we might use technology to enhance our bodies and lengthen our lives. While it may not be apparent to us, we have already begun to use technology to enhance what our bodies can do. For example, cochlear implants, which provide those who are deaf with a sense of hearing, are a way in which we have shown that our brains and technology can work together. While the human brain cannot be explained entirely by a computer model, Eagleman explores how human-like robots, brain simulations, and attempts to “upload” our brains may all contribute to an understanding of the brain, and of how we can use technology to preserve ourselves for a long time.
The Brain: The Story of You will be of great interest for those seeking to understanding the human brain and how it makes us who we are.
Eagleman, D. (2015). The Brain: The story of you. Pantheon.
A just-published study asks about the effect of schooling on the brain. (A chatty, readable summary by one of the authors can be found here.)
More specifically, it looks at a young child’s ability to self-regulate: a skill that early schooling emphasizes–and, of course, one that’s highly necessary for sustained success in almost any meaningful activity or relationship.
The authors take advantage of the arbitrary cut-off date for schooling, and look at brain development for children who were just old enough–or not quite old enough–to enroll in 1st grade.
The research question was: can we find meaningful differences in self-regulatory areas of the brain after a year of 1st grade (children just within the cut-off date) compared to a year of kindergarten (children just beyond the cut-off date)? Did these brains develop alike over the course of this year, as part of typical human development? Or, did the more academic structure of 1st grade influence brains to develop differently than the more playful freedom of kindergarten?
The result:
The research team found meaningful developmental differences in a specific region of the prefrontal cortex, and also in the posterior parietal cortex. Earlier work has shown both regions to be parts of neural networks that participate in self-regulation.
In other words: the greater structure of 1st grade seemed to bulk up neural regions often used for self-regulation.
In quite predictable ways, that is, schooling changes brains.
The Bigger Picture
I was drawn to this study because of a headline: “How does going to school change your brain?”
In the current world of education, we hear this phrasing quite often:
Taxi drivers in London–who must learn very complex street maps–have different brains from people who don’t learn those maps. Map learning changes your brain!
Learning a foreign language actually changes your brain!
Playing the bagpipes not only makes you sexy, but it also changes your brain!
You may well have heard this claim quite often in the world of education. It’s an especially popular point among folks who have something to sell.
So here’s an important secret: if you do something often, practically everything changes your brain.
If you nap regularly at 3, I suspect your brain is different from the brains of people who don’t. If you run marathons, doing so changes your brain. Or, juggling. Or, learning calculus.
Or–I don’t know–walking up stairs backwards.
Brains change. Often. It’s what they do.
I honestly don’t quite understand the reverence with which people utter the words “collecting chia pets actually changes your brain!” Over a decade ago, neuroscientists believed that brains didn’t change much once they were fully formed, so I understand why they are still awestruck by this fairly recent discovery.
But the rest of us? I’m surprised most non-neuroscientists are invested enough in the changelessness of brains to care one way or the other.
Here’s a test I occasionally use: when I hear the words “actually changes your brain,” I mentally substitute the words “happens while you’re breathing.” If that second sentence would surprise me, then I’ll be surprised by the first.
So, for example: “Ball-room dancing classes actually change your brain!” becomes “Ball-room dancing classes happen while you’re breathing.” Nope, not surprised.
Back to Where We Started
If it’s not surprising that a structured academic environment (1st grade) affects brains differently than a playful environment (kindergarten), what should we do with this study?
For teachers, the answer is: not much. This research result is interesting, but not at all surprising. When one group of students spends a year in a somewhat different environment than another group, those groups develop differently–both in their behavior and in their neural structures.
Put differently, we might summarize the research result this way: at the neural level, 1st grade works. It creates the changes we want it to change. (Or, more precisely: the changes we see in neural networks make sense given what we know about their behavioral correlates.)
For neuroscientists, the answer is: celebrate. Given that neuroplasticity is a relatively recent finding, it’s quite amazing that specialists can now predict where brain changes might happen, and then find those very changes after 9 months. 20 years ago, all of this would have been impossible. Today, it’s not only doable–it’s been done.
In other words: I don’t think you and I will teach any differently because of these findings. But, this study gives us even more confidence that neuroscience and education will come to inform each other more and more often.
As another April has come and gone, so has another World Autism Month. The Light It Up Blue campaign celebrates each spring with a renewed push for greater understanding and acceptance of individuals with autism spectrum disorder.
And with greater attention to autism (hopefully) comes greater attention to learning and developmental disabilities more broadly. In the context of education, this means greater attention to the who, what, and why of special education (SPED) services.
Special education provides a public education, generally through implementation of individualized curricula, to students with intellectual, learning, developmental, and/or physical disabilities. [1]
Or does it? In the last decade, researchers and policymakers have begun to take a closer look at the students enrolled in SPED. Red flags have emerged, to say the least.
The Numbers Don’t Add Up
At the forefront of concern is evidence of substantial disproportionality in SPED enrollment. Disproportionality arises when a group, such as a racial or ethnic minority, is represented in SPED at a greater rate than they comprise within their school, community, or nation. For example, if a school is comprised of around 65% white students, we should expect that the SPED classrooms are also comprised of around 65% white students.
Yet in nearly every state, rates of SPED enrollment show evidence of overrepresentation of minority groups. [2]
Now, before delving into the possible factors contributing to such disproportionality, it is worth noting that special education is still relatively new to U.S. public education. SPED was first enacted in 1973 and has gone through several policy iterations to reach its current form: the Individuals with Disabilities Education Act (IDEA).
IDEA mandates that education services for children with disabilities must meet students’ individual needs and must take place in the least restrictive environment possible (ideally with non-disabled students). As well, and perhaps most important for the current discussion, is the mandate that SPED assignment can happen only after appropriate enrollment procedures have concluded. These procedures include aptitude and achievement tests, teacher recommendations, and considerations of the student’s cultural background. [1]
Despite IDEA’s requirements, however, SPED services do not appear to be distributed equitably. [3] Enrollment data show that students of color consistently experience disproportionate inclusion in SPED, and this issue has actually come to the attention of Congress more than once. During both the 19thand 22nd Annual Reports to Congress, the Office of Special Education Programs (OSEP) and the Office of Civil Rights (OCR) reported that students of color may be being misclassified or inappropriately placed in SPED, that such placement may be a form of discrimination, and that SPED students may be receiving services that do not meet their needs. [4]
Red Flags
What kind of disproportionality are we talking about? Let’s look at a snapshot of some of the numbers and contexts that researchers have been tracking:
despite Black children constituting only 17% of total school enrollment, they comprise 33% of children diagnosed with mental retardation (now referred to as intellectual disability, ID) [5]
Black boys are, on average, 5.5 times more likely to be diagnosed as emotionally disturbed (ED) than are white girls [6]
American-Indian boys are, on average, nearly three times more likely than white girls to be diagnosed with a learning disability (LD) [6]
among students with disabilities, 57% of Hispanics are educated in partially separate or substantially separate settings and denied access to inclusive settings, compared to 45% of whites [7]
English language learners (ELL) are 27% more likely to be placed in special education during the elementary school grades [8]
Where to Begin?
Those are some pretty troubling statistics, and researchers have endeavored to get to the bottom of them. But as one might expect, disproportionality is a complex, layered issue.
And a potentially misleading one. For example, a natural response to reading the numbers above might be that disproportionate overrepresentation is worse than disproportionate underrepresentation. We would be remiss to take that thought as a blanket statement, though. After all, while overrepresentation may reflect heightened disapproval of minority students’ behavioral or academic performance, underrepresentation may reflect minority students’ struggles going unnoticed. And that latter possibility isn’t any better than the former.
For example, the diagnosis of Intellectual Disability in Black students has been shown to decline as poverty increases. [2] In other words, the poorest Black students may be the least likely to be identified as having ID. But, there is still a disproportionately high rate of Black children in SPED who are diagnosed with ID overall.
Such nuanced findings may suggest that Black students are being over- and under-monitored based on their socioeconomic background in addition to, or in lieu of, their academic profile.
Thus, the story that needs to be uncovered is not only the extent of disproportionality (i.e., the raw numbers) but also the forms (i.e., the diagnoses) and the causes.
What’s Happening with SPED Assessment?
Turning to causality in particular, some researchers have hypothesized that the assessment procedures required by IDEA for SPED enrollment may be less rigorous in practice than on paper. In an investigation of how qualitative factors, such as personal beliefs, may affect the rigor of psychological/educational evaluation, Harry, Klinger, Sturges, & Moore (2005) investigated community perceptions of the validity of SPED referrals throughout urban schools in Southern Florida. [9] Extensive interviews with teachers, administrators, and families uncovered a high level of confidence in school-ordered assessments.
That is, the interviewees believed that students would be referred for, and enrolled in, SPED only after a true need for such services was found. Which sounds good! But, paradoxically, this high level of confidence may actually lead to harmful results.
Because from the get-go, students may be vulnerable to inappropriate SPED placement if members of their family, school, and community are unlikely to examine a referral critically. Further, given that studies have found Limited English-Proficient students to be more likely to be placed in SPED, families that experience a language or cultural barrier to their child’s school may face particular disadvantage in advocating for their child.
These same researchers also found that teachers’ perceptions of a student’s learning difficulties, as well as their perception of dysfunction existing within a student’s family, predicted their students’ SPED assessment results. This may indicate a complex process through which a teacher’s perception of a student influences the nature of their interactions (e.g., challenging the student less due to lower expectations), which in turn contributes to lower levels of student achievement and, eventually, consideration for SPED.
Other researchers, however, have suggested that psycho-educational assessment is not the main event in SPED placement at all. [8] Rather, disproportionate referrals may arise from the ongoing failure of regular education classrooms to serve racial and ethnic minority students. They argue that it is the quality of a student’s classroom instruction, and the level of management within the classroom, that should be most emphasized during student assessment. This emphasis would allow for underachievement to be seen as the result of a poor learning environment rather than individual student failure.
What Other Factors Underlie Disproportionate Representation?
Overall, most researchers have concluded that disproportionality in SPED is the result of:
subjective student identification practices (e.g., teachers’ interpretation of the same behaviors differently depending on the student);
blatant violations of IDEA’s guidelines;
and antiquated systems of SPED funding based on category of disability (i.e., schools receive more money if a student is diagnosed with Intellectual Disability than if diagnosed with Dyslexia). [10]
Yet other studies have begun to take a new, ecological approach in their investigations. For example, based on the assumption that low-income students are more likely to be students of color, several researchers have asked: is poverty is associated with increased risk for SPED enrollment?
In one such study, Strand & Geoff (2009) analyzed the 2005 Pupil Level Annual School Census – a data set of 6.5 million students in England. [11] The authors found that poverty and gender explained more disproportionality in SPED enrollment than did ethnicity; but, the overrepresentation of students of color in SPED was still significant even after controlling for poverty. It appears, then, that some degree of interplay between individual (e.g., academic strengths and weaknesses, learning support at home) and environmental (e.g., socioeconomic conditions, teacher and societal beliefs) factors significantly contribute to placement in SPED classrooms.
Getting to the Bottom of it
So far, researchers seem to have a lot of pieces of the disproportionality puzzle in a lot of places. How do we put them all together–at least enough so that we can begin to do something about it?
To start, Oswald, Coutinho, & Best (2005) recommend a new research agenda. They advocate for disproportionality studies to focus specifically on disentangling social factors (such as systemic bias) from individual factors (such as differential susceptibility) as an underlying cause of over- or underrepresentation in SPED. [6]
These authors argue that studies should investigate whether students of certain racial or ethnic groups are differently susceptible to schooling contexts such as low-quality instruction, loose classroom management, or particular academic interventions. Under the theory of differential susceptibility, it is perhaps so that some students fare better in special education classrooms than others, making them more likely to be placed back into regular education.
They also advocate for assessment procedures that compare an individual’s performance to the performance of students of similar characteristics. For example, the achievement of a Hispanic female youth should be compared to the average performance of similar female students within their school or district (i.e., not their non-Hispanic classmates). If differential susceptibility to an aspect of the educational environment exists for some racial or ethnic minorities, assessment procedures that compare similar students may provide the most accurate depiction of an individual successes or challenges.
No Time Like the Present
It is clear that disproportionality exists within SPED. But what it less clear is why, or how to fix it. Given that it is a relatively new addition to public education, however, we can hope that the inequity currently seen in SPED may not yet be as deeply rooted as some of the challenges that regular education faces (e.g., school segregation).
Nonetheless, time is of the essence for new research! It is only with a better understanding of the roles that various factors play in SPED disproportionality that the development (and enforcement) of policy interventions can commence.
[Editor’s note: this post was written by Lindsay Clements. The initial byline, saying that it had been written by me, was incorrect. My apologies for the mistake.]
References
[1] U.S. Department of Education Office for Civil Rights (2010). Free Appropriate Public Education for Students With Disabilities: Requirements Under Section 504 of the Rehabilitation Act of 1973, Washington, D.C.
[2] Parrish, T. (2005). Racial disparities in the identification, funding, and provision of Special Education. In D.J. Losen & G. Orfield (Eds.), Racial Inequity in Special Education (pp.15-37). Cambridge, MA: Harvard Education Press.
[3] McDonald, K.E., Keys, C.B., & Balcazar, F.E. (2007). Disability, race/ethnicity and gender: Themes of cultural oppression, acts of individual resistance. American Journal of Community Psychology, 39, 145-161. doi:10.1007/s10464-007-9094-3 [link]
[4] U.S. Department of Education (1997). Nineteenth annual report to Congress. Washington, DC: Author.; U.S. Department of Education (2000). Twenty-second annual report to Congress. Washington, DC: Author.
[5] Losen, D.J. & Orfield, G. (2005). Racial inequity in special education. In D.J. Losen & G. Orfield (Eds.), Racial Inequity in Special Education (pp.xv-xxxvii). Cambridge, MA: Harvard Education Press.
[6] Oswald, D.P., Coutinho, M.J., & Best, A.L.M. (2005). Community and school predictors of overrepresentation of minority children in Special Education. In D.J. Losen & G. Orfield (Eds.), Racial Inequity in Special Education (pp.1-13). Cambridge, MA: Harvard Education Press.
[7] Garcia Ferros, E. & Conroy, J.W. (2005). Double jeopardy: An exploration of restrictiveness and race in special education. In D.J. Losen & G. Orfield (Eds.), Racial Inequity in Special Education (pp.39.70). Cambridge, MA: Harvard Education Press.
[8] Artiles, A.J., Rueda, R., Salazar, J.J. & Higareda, I. (2005). Within-group diversity in minority disproportionate representation: English language learners in urban school districts. Exceptional Children, 71(3), 283-300. [link]
[9] Harry, B., Klinger, J.K., Sturges, K.M., & Moore, R.F. (2005). Of rocks and soft places: Using qualitative methods to investigate disproportionality. In D.J. Losen & G. Orfield (Eds.), Racial Inequity in Special Education (pp.71-92). Cambridge, MA: Harvard Education Press.
[10] Reschly, D.J. (2000). IQ and Special Education: History, current status, and alternatives. Unpublished paper, National Academy of Sciences, National Research Council, Washington, DC.
[11] Strand, S., Geoff, L. (2009). Evidence of ethnic disproportionality in special education in an english population.The Journal of Special Education, 43(3), 174-190. [link]
In recent weeks, this blog has written about the dangerous assumption that students can just get all their information from The Google, and the implication that they therefore don’t need to know much factual knowledge. (Those posts are here and here.)
In yesterday’s New York Times, Daniel Willingham took up the same topic. If you don’t know Willingham’s work, a) you should, and b) this article will be a lovely introduction to his thoughtfulness and clarity.
This story offers both good and bad news: I’ll let you sort out whether there’s more good than bad…
The bad news: according to a just-published study, 58% of college professors in Britain believe in learning styles theory. This belief persists despite considerable evidence showing that…well…the theory just isn’t true.
(More precisely: considerable evidence showing that the many conflicting versions of the theory don’t have good evidence to support them.)
The good-ish news: although 58% is too high, it’s also lower than other numbers found in surveys of British K-12 teachers.
The oddly good news: although many profs believe in this theory, relatively few of them do anything about it. That is, only 33% report using any specific techniques that they ascribe to learning styles theory.
In my view, that’s good news (because relatively few people are doing anything with a potentially harmful theory), but also bad news (because we want teachers to use the (correct) conclusions of learning science that they believe in).
In other words: in our ideal world, we want all teachers to KNOW what psychology and neuroscience can accurately tell us about learning–and we want them to USE that knowledge.
Learning Styles vs. Individual Differences
Paradoxically, many people believe in learning styles theory because they misunderstand it.
The theory says that we can divide people up into different groups of learners (“visual, auditory, kinesthetic” is the best-known version of the theory), and then teach those groups in ways that match their style. If we do so, they’ll learn better.
However, I think most people understand learning styles theory this way: “all people learn differently, and therefore I should present my content in different ways to be sure that all people can get it in their unique way.”
This theory a) is absolutely true, and b) is NOT what learning styles theory says.
Learning styles theory, again, says that we can diagnose distinct categories of learners, and teach people within those subgroups the same way.
This second theory–called “individual differences”–says that we all learn somewhat differently from each other.
There is no group of people who learn exactly the same way I do. I’m a learning style of one.
For this reason, we could “teach to a student’s learning style” only if everyone were tutored individually. Because schools teach students in groups, teachers should indeed teach all content in many different ways–so that each of us with our individual learning styles can grok these new ideas.
If I truly believed in learning styles theory, I should–instead–test all of my students to determine their style, and then sort them into distinct groups. After that sorting has happened, I should then teach each group differently; all people in each subgroup learn the same way, so they’ll learn best when I teach in that one style only.
What to Do with this Research?
Are you already teaching your content in multiple different ways? If yes, then you’re already following an individual differences theory (not learning styles theory). Keep doing what you’re doing.
If no, try to do so as much as possible. If your students don’t understand when you explain a concept one way, try drawing a picture. Or, use several analogies. Or, have a hands-on demo. Or, give several examples, and have students abstract a principle from them. Or, have students explain it to each other. Or, find a song that enacts the concept you want to explain. Or…
If you’re still a learning styles enthusiast, I suggest that you click some of the links above and see why psychologists just don’t believe the theory. You might also check out Chapter 7 of Daniel Willingham’s Why Don’t Students Like School?; as always, he does an excellent job of clarifying a complex topic.
You should also keep asking questions when you get to the next Learning and the Brain conference. You’ll meet plenty of wise and well informed people who can distinguish between “learning styles” and “individual differences,” and contrast the evidence behind both.
Regular readers of this blog remember Scott MacClintic’s post about “data informed instruction”; quoting W. Edwards Deming, Scott notes that “without data, you’re just another person with an opinion.”
Of course, gathering the right kind of data can be very tricky. What should we gather? How should we gather it?
Researchers at San Francisco State University have specific answers to both of these questions.
As they pondered STEM teaching, this research team asked some basic questions: how much classroom time is devoted to lecture, how much to pair discussion, and how much to reflective writing or clicker questions?
(The underlying goal: encourage more discussion and writing.)
To answer these questions–that is, to gather this kind of data–they developed a system that can listen to classroom sound and keep track of lecture time, discussion time, and silent working time.
We can hope a) that this system will be tested for other disciplines and other academic levels, and b) that it will be as handy as an app in the near future.
If these hopes come true, then with the click of a few buttons, we can get useful information about our own teaching practices, and fine-tune the balance of our pedagogical strategies.
(The “DART” is currently “under revision”; I don’t know when it will be back up and running.)
Until then, it’s good to know that–despite all the vexations that come with technology–it can still help us hone our craft and benefit our students.
You think grades interfere with learning? You’d like to do away with them? And yet, you’d like some consistent way to measure students’ academic development? And to communicate that development to others?
You’re not alone.
The Mastery Transcript Consortium seeks to accomplish these very goals.
The plan itself is layered and intricate; if you’re interested, it’s worth your time to read this article from Inside Higher Ed.
At present, the plan is in its very early stages: no schools currently use it, because it doesn’t yet exist. But, having just gotten a $2 million dollar grant to develop it, the consortium is hopeful that they have launched a movement that can reshape the educational landscape.
[Full disclosure: this plan has been developed by Scott Looney, head of Hawken School outside Cleveland, OH. I myself was a lifer at Hawken, and have spoken with Mr. Looney about his plans. Although I have done some consulting work with Hawken faculty, parents, and students, I am not involved in the Mastery Transcript project.]
A recent study suggests that 3- and 4-year old children understand as much, and learn as much vocabulary from, digital books as from read-alouds with adults.
This study hasn’t been published–it was presented at a recent conference–so we can’t look at all the details with the specificity that we usually do. (And, skeptics will rightly be concerned that the research was funded by Amazon: a company that might well profit from its conclusions.)
At the same time, the description I’ve linked to sounds plausible and responsible, so I’m not inclined to dismiss this finding out of hand.
The authors’ conclusions conflict with some other findings in related fields. You may remember a recent blog post discussing Daniel Willingham’s conclusion that, on the whole, students learn more from books than from e-readers.
I’ve also been interested in a study by Ackerman and Goldsmith showing that students regulate their learning better with books than e-readers.
But the current study isn’t about college students trying to learn from books; it’s about pre-readers trying to follow a story that’s being read to them. In this one paradigm, the researchers have found that the right kind of e-book can do the job as well as the right kind of adult.